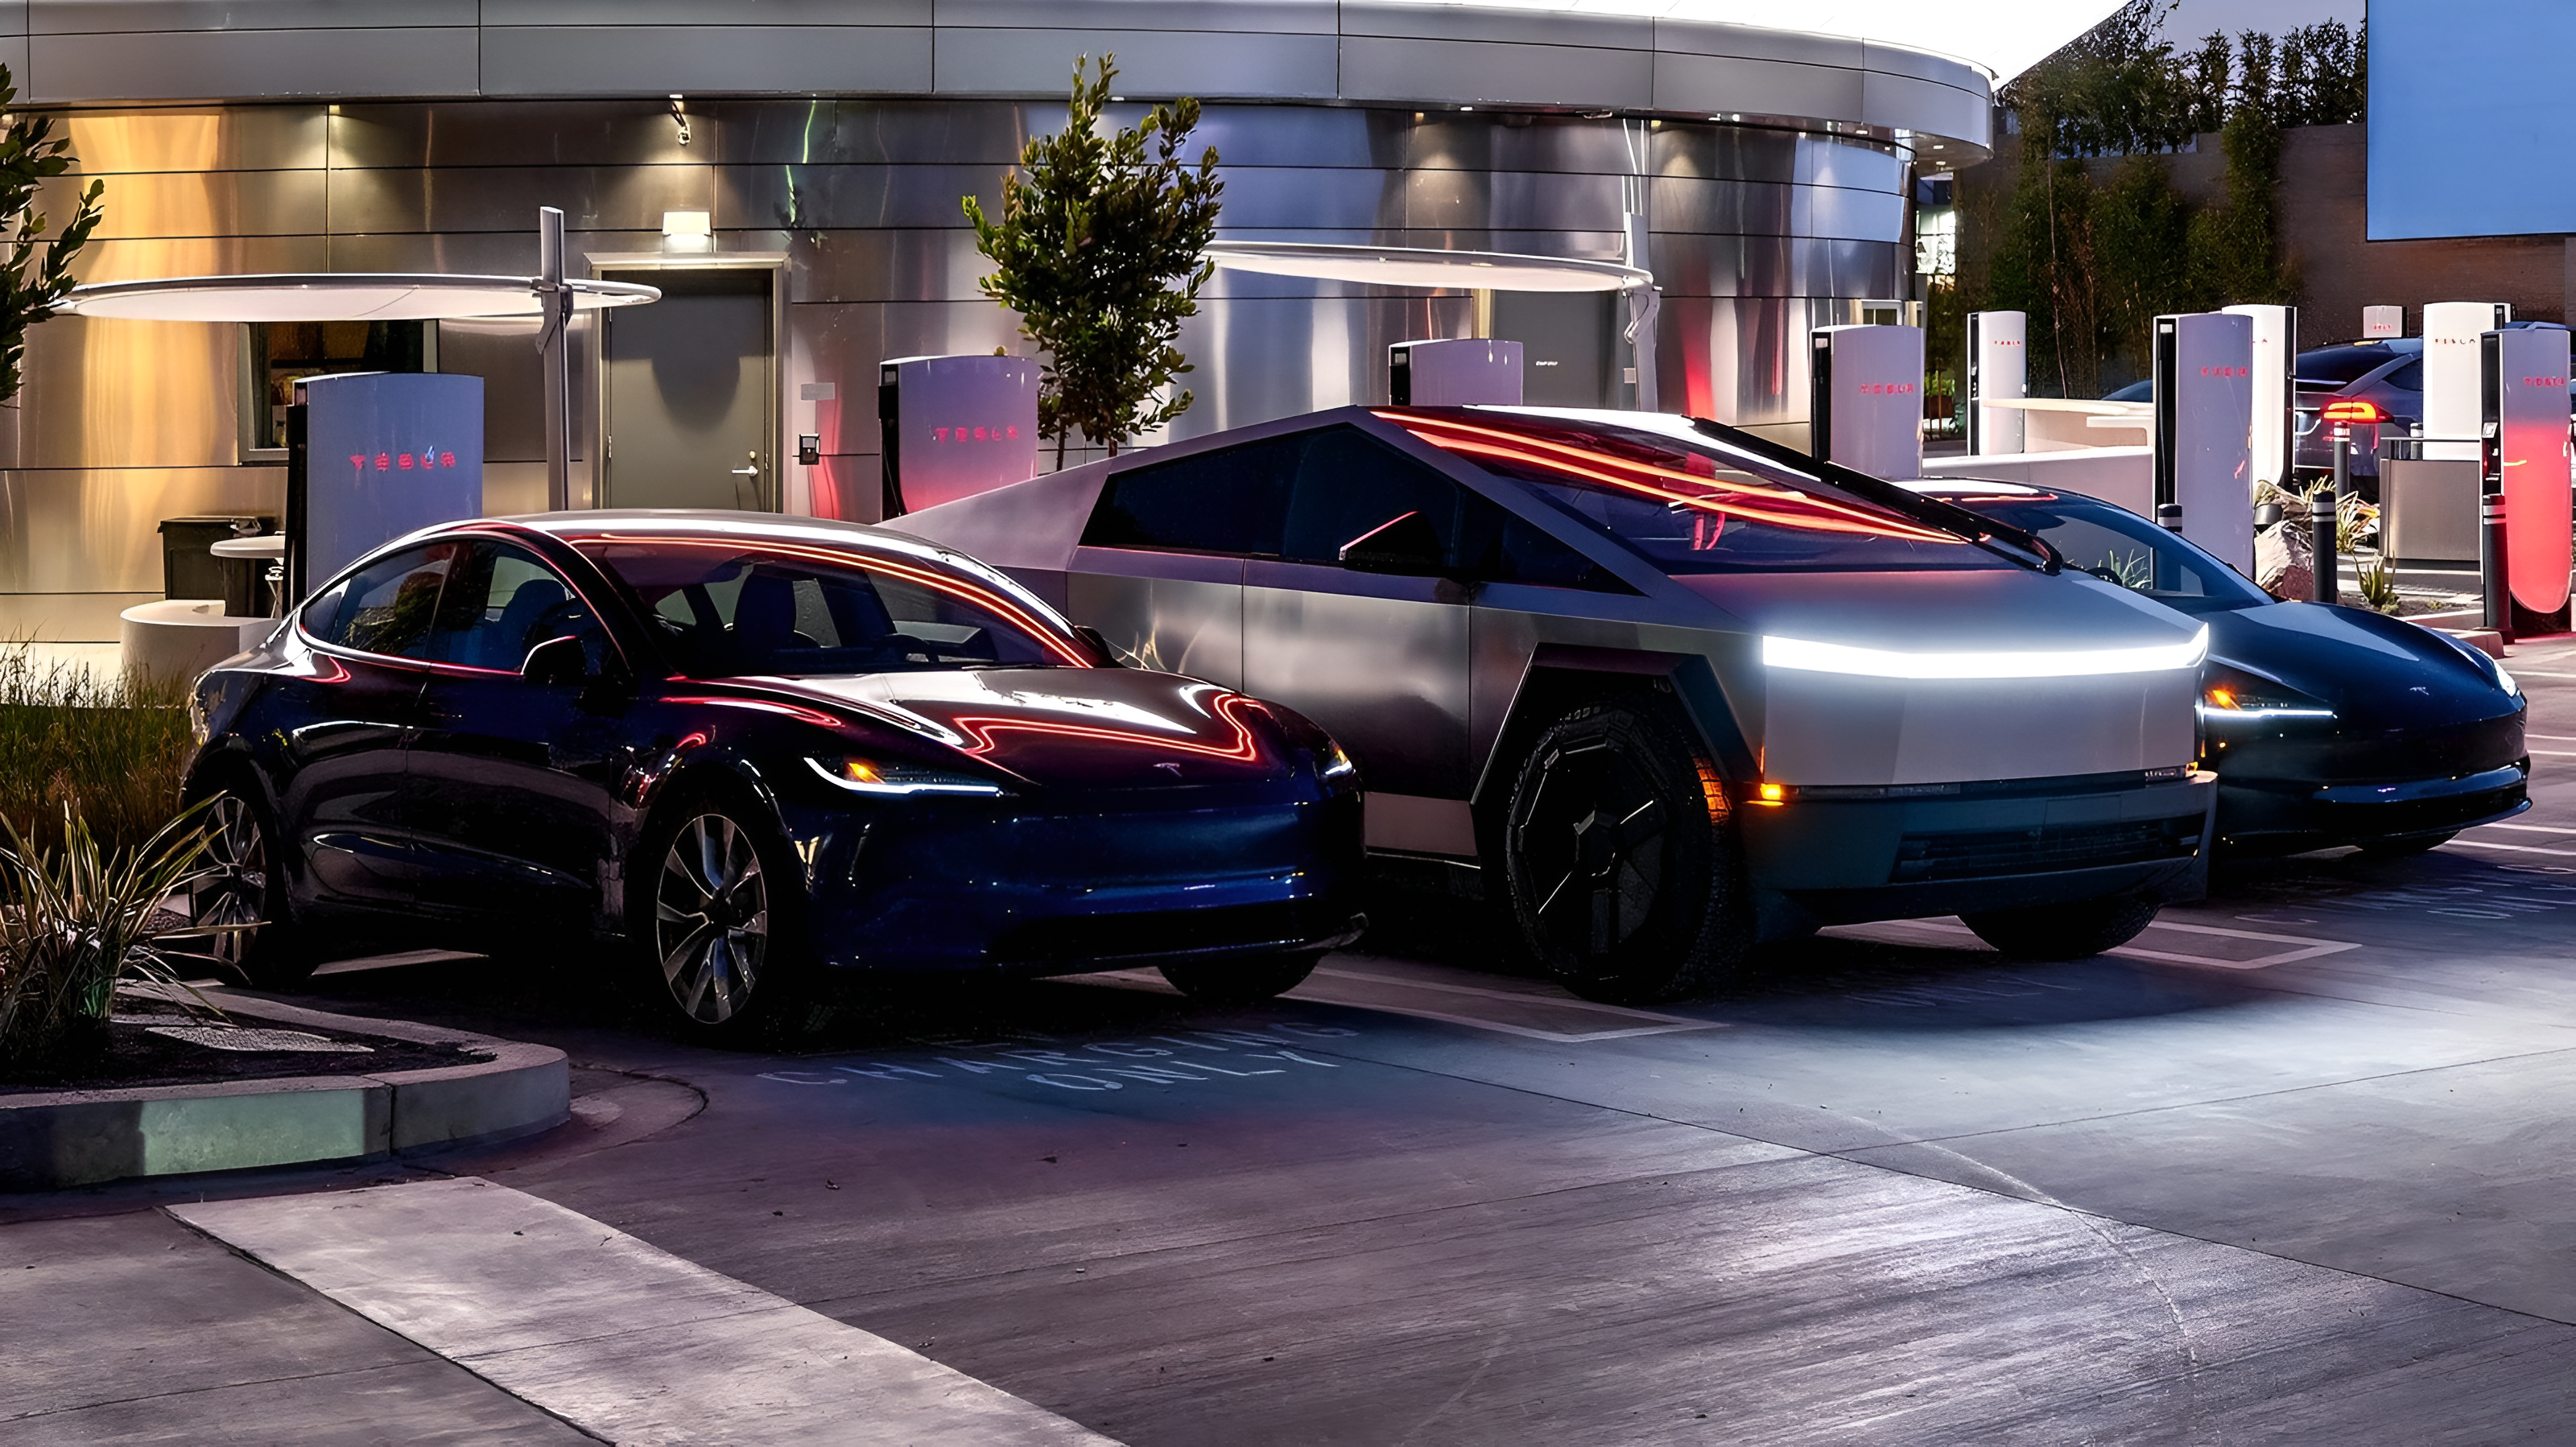
Ionna, Mercedes and Rivian End Tesla’s Five-Year Charging Satisfaction Lead
Tesla’s Supercharger network has lost the public fast-charging satisfaction lead it held for five years. In the 2026 J.D. Power U.S. Electric Vehicle Experience Public Charging Study, the automaker-backed networks from Ionna, Mercedes-Benz and Rivian all ranked ahead of Tesla even as failed public-charging attempts across the market fell to a record-low 12%.
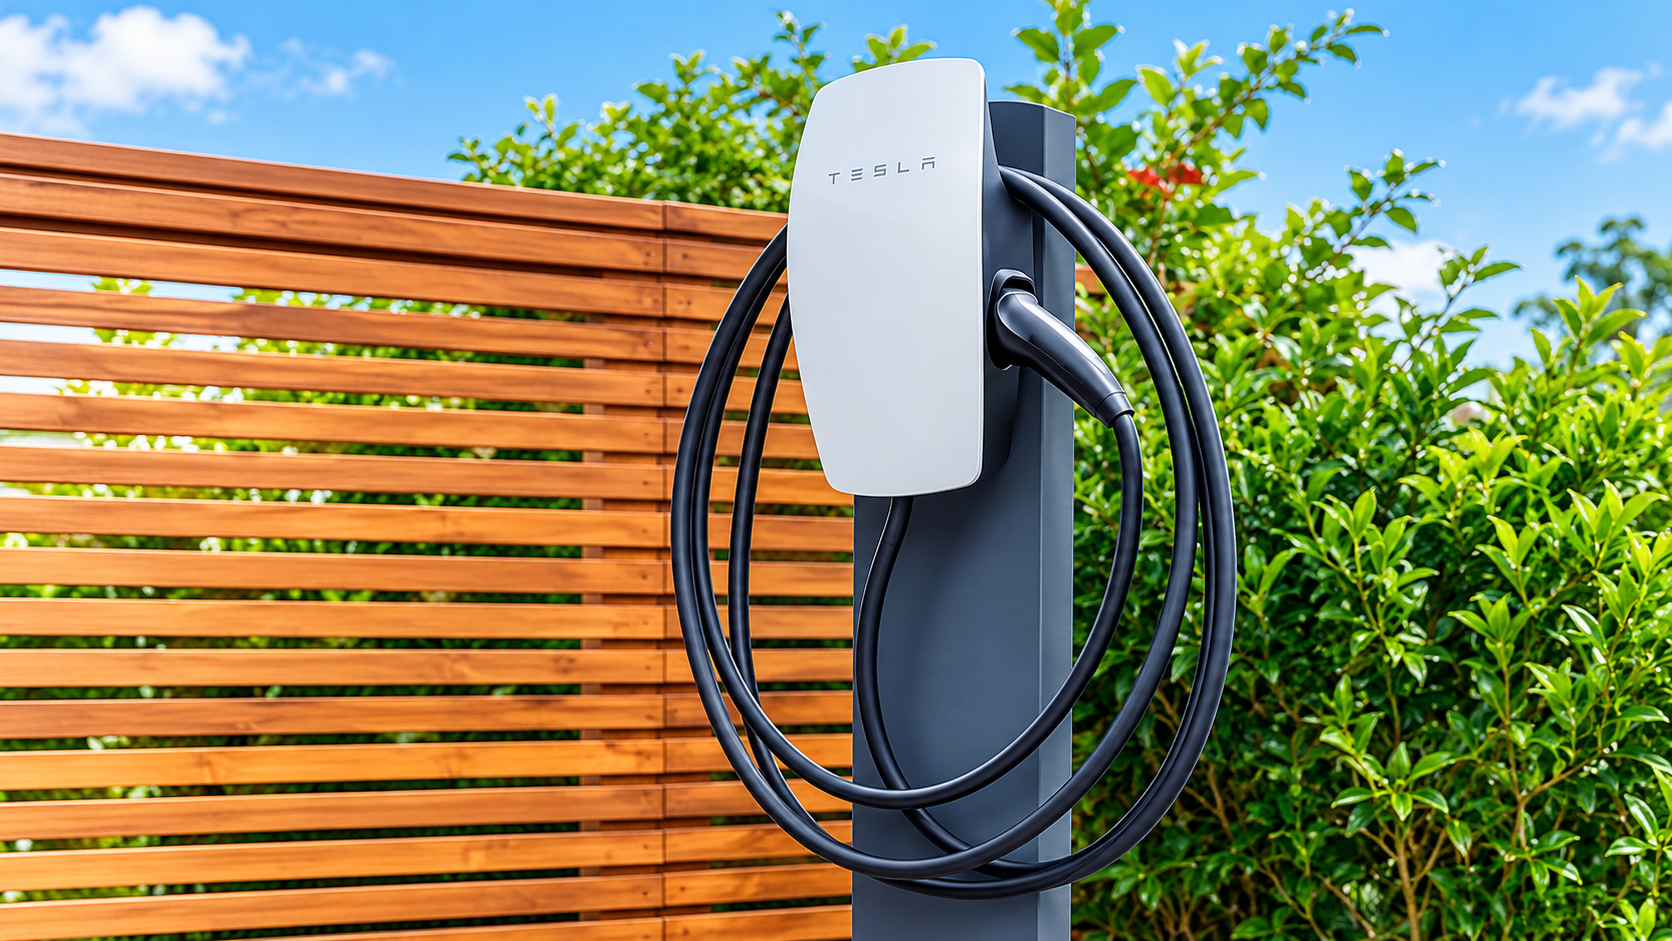
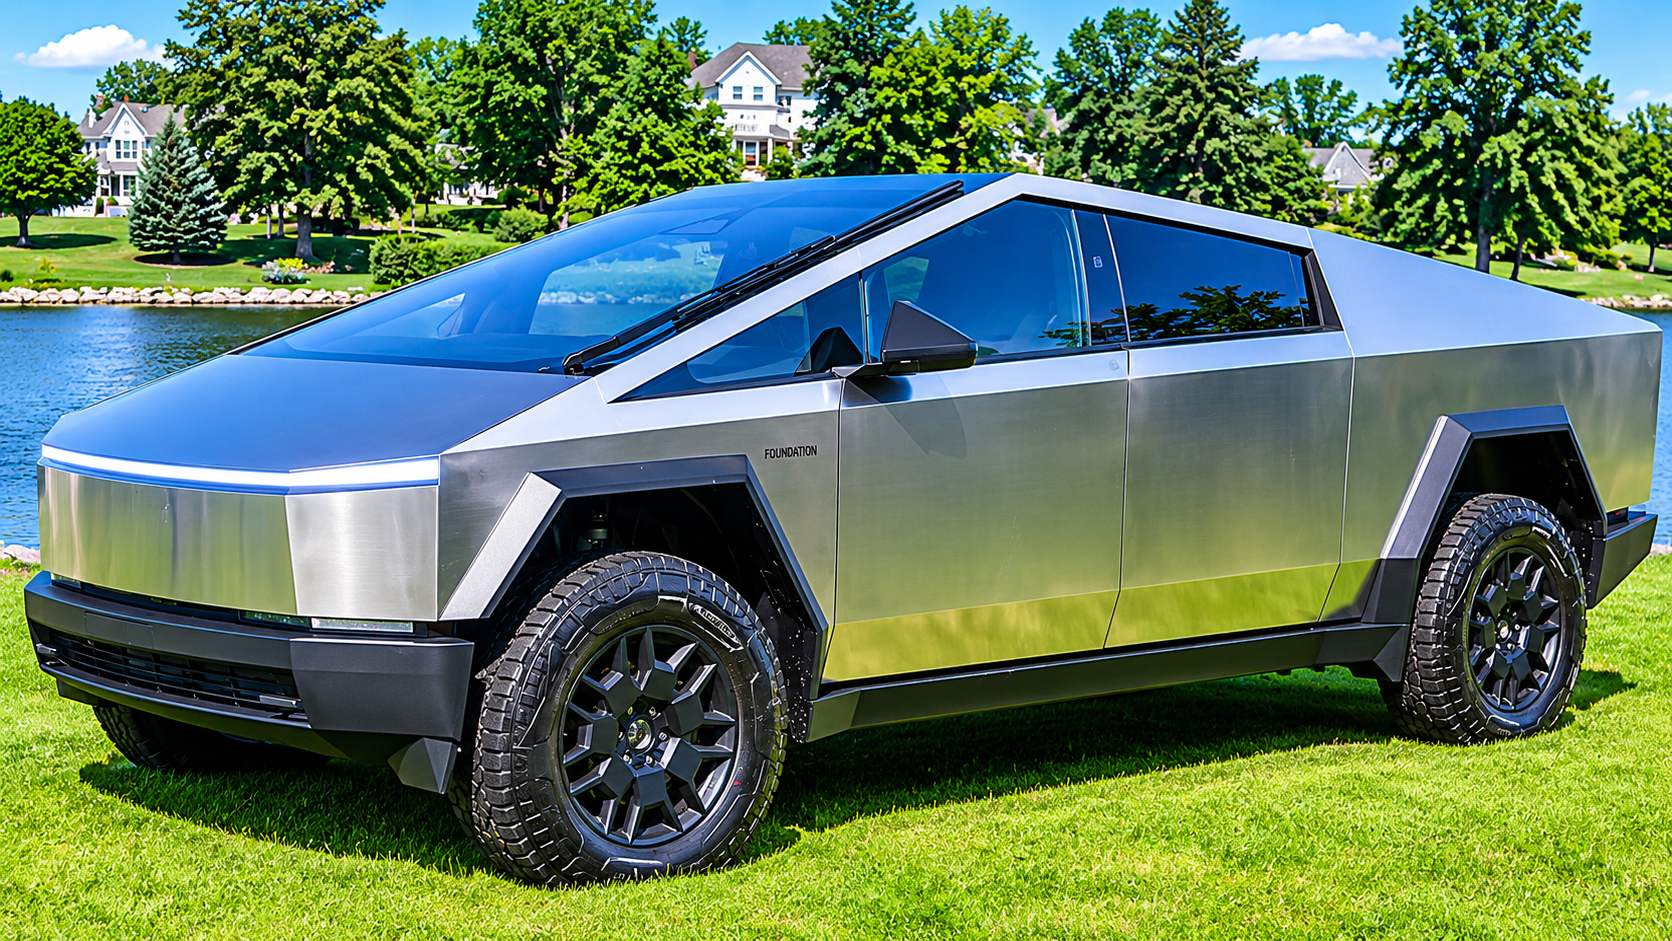
Ionna entered the ranking in first place with 807 points on J.D. Power’s 1,000-point scale. The Mercedes-Benz Charging Network followed at 797, while the Rivian Adventure Network scored 755. Tesla placed fourth at 701, down from 709 in 2025 after ranking first from 2021 through 2025. All four finished above the 2026 fast-charging segment average of 666.
New networks raised the standard at the charging site
The ranking is a comparison of customer satisfaction, not network size or geographic coverage. The study, produced with PlugShare, used responses from 6,594 owners of battery-electric and plug-in hybrid vehicles collected between January and June 2026. J.D. Power measures 10 factors, including charging ease and speed, charger condition and availability, location, amenities, perceived safety, cost and payment.
The three newly eligible automaker-backed networks posted their largest advantages in areas that drivers encounter directly: ease of charging, charging speed and charger availability. J.D. Power connected the wider improvement in fast charging to newer high-speed equipment, larger sites, destination-style locations with amenities and smoother payment processes.
Those attributes illustrate why charging performance is a systems-integration problem rather than a contest over peak electrical output alone. A powerful charger offers little practical value if its port is occupied, payment authorization fails, the vehicle and charger do not establish a session, or the site is difficult to enter and use. Site capacity, software, payment processing, hardware condition and the surrounding property all shape the completed charging experience.
Location scores reinforce that point. Fast chargers at hotels received the highest satisfaction score, at 692, followed by gas stations and convenience stores at 689 and restaurants at 688. Stand-alone parking lots and garages scored 606, while dealership chargers were lowest at 570. The spread suggests that amenities and the way drivers use their waiting time can matter alongside charging hardware.
Reliability improved, but one in 8.3 attempts still failed
Failed public-charging attempts declined to 12%, from 14% in 2025 and 19% two years earlier. That is substantial progress, but it still works out to approximately one failed attempt for every 8.3 attempts. For a driver depending on public infrastructure during a trip, the remaining failure rate can still create rerouting, delay and uncertainty.
Overall satisfaction with fast charging increased 12 points from 654 in 2025 to 666 in 2026. It improved across all 10 measured factors. Charger availability produced the largest gain, rising 27 points, while perceived safety at charging locations and charging cost each improved by 18 points.
The 12% failed-attempt figure should not be treated as interchangeable with equipment uptime. Federal rules for federally funded charging projects require each port to maintain average annual uptime above 97%, but that metric includes specified calculation rules and exclusions. A charging attempt can also fail because of payment, communications or vehicle-charger interaction even when equipment is nominally available. The federal charging standards consequently address more than uptime, including payment methods, network connectivity, interoperability, maintenance and real-time status information.
Slower public charging moved in the opposite direction
Public AC Level 2 charging did not share the fast-charging gains. Its satisfaction score fell 12 points, from 607 in 2025 to 595 in 2026, primarily because drivers gave lower marks for ease of payment and ease of charging.
That divergence exposes two different operating environments. Fast-charging sites can justify larger, newer installations built around short, high-value stops. Level 2 chargers are spread across a wider variety of parking facilities and host properties, where equipment ownership, network services, payment systems and maintenance responsibility may be divided among multiple organizations. The resulting experience can vary significantly from one location to the next.
Below the 666-point fast-charging average, Red E Charge scored 628, Electrify America 616, EVgo 601 and ChargePoint 583. Tesla remains above the segment average, but the 2026 results show that its long-running lead is no longer automatic. The next competitive threshold is more demanding: combining the polished experience of the leading new sites with broad coverage, while reducing the remaining one in 8.3 failed-attempt burden.
| More aerospace and engineering stories, right in your MSN feed. Follow AMI on MSN |
By Thomas Caldwell — AMI’s senior editor for mechanical and mobility engineering, covering vehicle electronics, systems integration, electrification, chassis systems, propulsion, and safety policy.