Ford Leads 2026 Mainstream Quality Ranking, but Test Covers 90 Days
Ford recorded 152 reported problems per 100 vehicles, the best score among mainstream brands in the 2026 J.D. Power U.S. Initial Quality Study. Nissan ranked second with 156 problems per 100 vehicles, followed by Buick with 162. Lower scores indicate fewer problems.
The result gives Ford a measurable lead in early ownership quality after the automaker reorganized its engineering and manufacturing controls. Its boundary is equally important: the study covers only the first 90 days of ownership, so it does not establish how Ford vehicles will perform over several years.
What Ford’s 152 score measures
J.D. Power based the 2026 study on responses from 78,514 purchasers and lessees of new 2026 model-year vehicles, supplemented by repair-visit data from franchised dealers. Information was collected from June 2025 through May 2026.
The study examines 227 owner questions and relevant repair data across 10 categories, including infotainment, controls and displays, exterior, driver-assistance features, interior, seats, powertrain, driving experience and climate systems. The resulting problems per 100-vehicles figure includes defects and malfunctions as well as owner-reported difficulty with how features are designed or operated.
Ford’s score also compares favorably with the broader market. Mainstream brands averaged 177 problems per 100 vehicles, while the industry-wide result improved from 192 in 2025 to 175 in 2026. J.D. Power called that the strongest year-over-year improvement since 1997.
The improvement was not uniform across vehicle systems. Nine of the study’s 10 categories posted fewer problems, but infotainment deteriorated as connectivity complaints increased. Among owners reporting a distraction-related problem, 46% identified infotainment or touchscreens as the source, compared with 18% who cited driver-assistance alerts. That finding shows why initial quality now depends on software behavior and control design as much as conventional assembly quality.
Ford’s result extended beyond one model
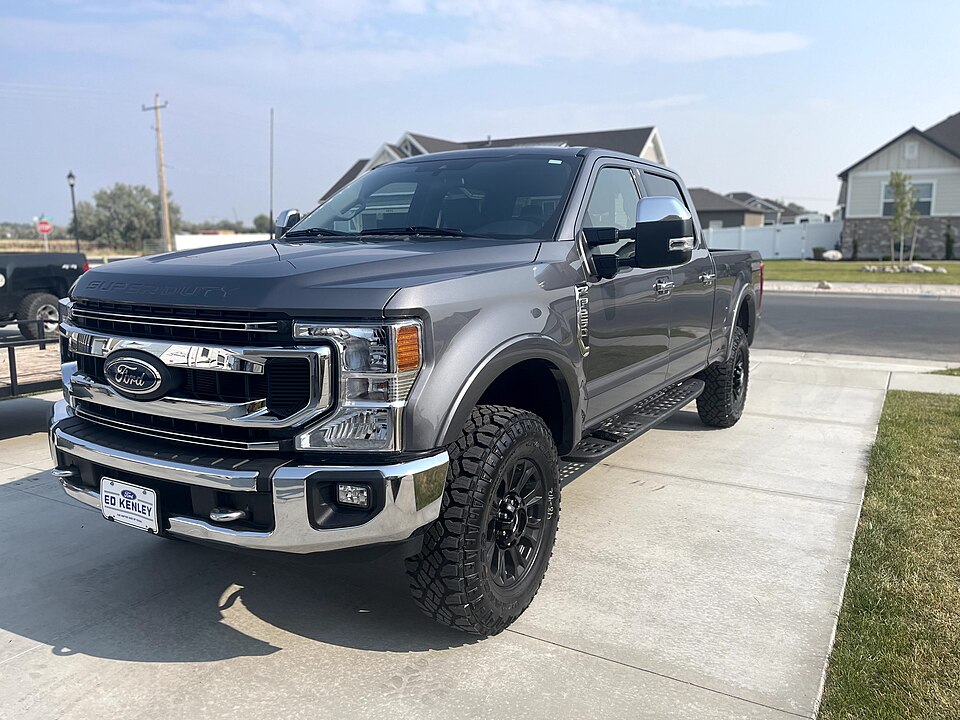
Three Ford vehicles the F-150, Mustang and Super Duty won their respective segments for the second consecutive year. The Escape, Explorer, Expedition and Maverick also placed among the top three in their classes. In total, seven of Ford’s 10 eligible vehicles earned a top-three position, described as the highest proportion achieved by any automaker in the study.
That distribution strengthens the case that Ford’s result reflects a companywide process rather than an isolated model success. It does not mean every Ford configuration or powertrain will produce the same ownership experience, but the breadth of the finishes is relevant because the lineup spans cars, compact pickups, full-size trucks and multiple SUV classes.
Organizational changes preceded the ranking
In 2023, Ford placed its engineering, manufacturing, supply-chain and quality-control teams under one organization. The company also hired 300 veteran engineers to identify potential problems before production and made weekly design reviews mandatory.
Those changes target a recurring systems-integration problem in vehicle development: a design can satisfy the requirements of one department while creating assembly, supplier or user-interface difficulties elsewhere. Bringing the responsible groups into a shared review structure can expose those conflicts before tooling is fixed and vehicles reach customers.
Ford says its preventive engineering work, tighter supply-chain coordination and updated quality-assurance software reduced vehicle-launch issues by 30% year over year. That figure is the company’s own assessment, while the J.D. Power ranking provides an external measure of what owners and dealer repair systems recorded during the opening months of use.
Initial quality is not long-term dependability
A 90-day study is useful for detecting launch defects, confusing controls, connectivity failures, trim problems and other issues that appear soon after delivery. It cannot capture years of component wear, corrosion, battery degradation or failures that emerge after repeated thermal and mechanical cycles.
Long-term reliability studies use a different time horizon and methodology. Consumer Reports, for example, asks members about problems experienced during the previous 12 months, weighs their severity and generally requires data covering at least two model years to calculate a predicted reliability score. That approach answers a different question from whether a new vehicle generated complaints during its first three months.
Ford’s 152 score therefore represents a significant early-stage result for its redesigned quality system, especially because seven eligible models placed in the top three. The longer test begins after that 90-day window, as the same vehicles accumulate mileage, software updates and years of service.
| More aerospace and engineering stories, right in your MSN feed. Follow AMI on MSN |
By Thomas Caldwell — AMI’s senior editor for mechanical and mobility engineering, covering vehicle electronics, systems integration, electrification, chassis systems, propulsion, and safety policy.